Contents
After creating profiles and immunizing your applications, openSUSE® becomes more efficient and better protected as long as you perform Novell® AppArmor profile maintenance (which involves analyzing log files, refining your profiles, backing up your set of profiles and keeping it up-to-date). You can deal with these issues before they become a problem by setting up event notification by e-mail, running periodic reports, updating profiles from system log entries by running the aa-logprof tool through YaST, and dealing with maintenance issues.
Applications that are confined by Novell AppArmor security profiles generate messages when applications execute in unexpected ways or outside of their specified profile. These messages can be monitored by event notification, periodic report generation, or integration into a third-party reporting mechanism.
For reporting and alerting, AppArmor uses a userspace daemon (/usr/sbin/aa-eventd). This daemon monitors log traffic, sends out notifications, and runs scheduled reports. It does not require any end user configuration and it is started automatically as part of the security event notification through the YaST AppArmor Control Panel or by the configuration of scheduled reports in the YaST AppArmor Reports module.
Apart from transparently enabling and disabling aa-eventd with the YaST modules, you can manually toggle its status with the rcaaeventd init script. The AppArmor event daemon is not required for proper functioning of the profiling process (such as enforcement or learning). It is just required for reporting.
Find more details on security event notification in Section 26.2, “Configuring Security Event Notification” and on scheduled reports in Section 26.3, “Configuring Reports”.
If you prefer a simple way of being notified of any AppArmor reject events that does not require you to check your e-mails or any log files, use the AppArmor Desktop Monitor applet that integrates into the GNOME desktop. Refer to Section 26.4, “Configuring and Using the AppArmor Desktop Monitor Applet” for details.
Security event notification is a Novell AppArmor feature that informs you when systemic Novell AppArmor activity occurs. Activate it by selecting a notification frequency (receiving daily notification, for example). Enter an e-mail address so you can be notified by e-mail when Novell AppArmor security events occur. Select one of the following notification types:
- Terse
Terse notification summarizes the total number of system events without providing details. For example:
jupiter.example.com has had 41 security events since Mon Sep 10 14:53:16 2007.
- Summary Notification
Summary notification displays the logged Novell AppArmor security events and lists the number of individual occurrences, including the date of the last occurrence. For example:
AppArmor: PERMITTING access to capability ’setgid’ (httpd2-prefork(6347) profile /usr/sbin/httpd2-prefork active /usr/sbin/httpd2-prefork) 2 times, the latest at Sat Oct 9 16:05:54 2004.
- Verbose Notification
Verbose notification displays unmodified, logged Novell AppArmor security events. It tells you every time an event occurs and writes a new line in the verbose log. These security events include the date and time the event occurred, when the application profile permits and rejects access, and the type of file permission access that is permitted or rejected. Verbose notification also reports several messages that the aa-logprof tool (see Section 23.6.3.5, “aa-logprof—Scanning the System Log”) uses to interpret profiles. For example:
type=APPARMOR_DENIED msg=audit(1189428793.218:2880):
      operation="file_permission" requested_mask="::w" denied_mask="::w" fsuid=1000 name="/var/log/apache2/error_log" pid=22969 profile="/usr/sbin/httpd2-prefork"
![[Note]](admon/note.png) | |
You must set up a mail server that can send outgoing mail using the SMTP protocol (for example, postfix or exim) for event notification to work. | |
In the section of the window, click .
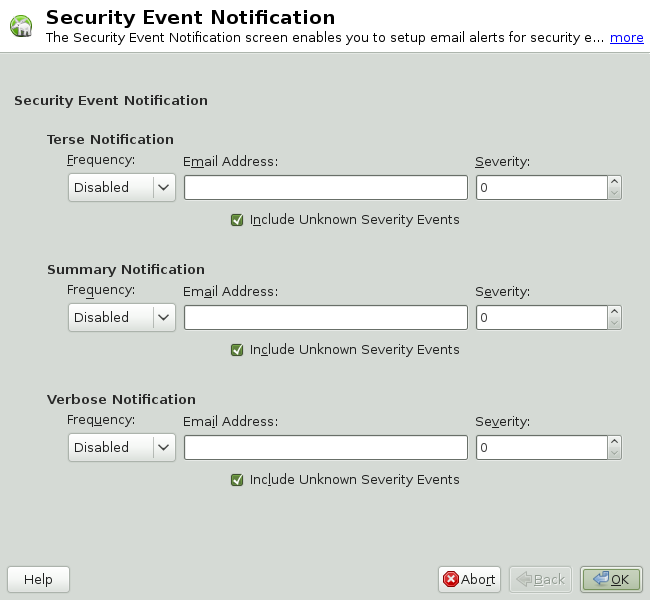
In the window, enable , , or event notification.
In each applicable notification type section, enter the e-mail addresses of those who should receive notification in the field provided. If notification is enabled, you must enter an e-mail address. Separate multiple e-mail addresses with commas.
For each notification type enabled, select the frequency of notification.
Select a notification frequency from the following options:
Disabled
1 minute
5 minutes
10 minutes
15 minutes
30 minutes
1 hour
1 day
1 week
For each selected notification type, select the lowest severity level for which a notification should be sent. Security events are logged and the notifications are sent at the time indicated by the interval when events are equal to or greater than the selected severity level. If the interval is , the notification is sent daily, if security events occur.
![[Note]](admon/note.png)
Severity Levels Novell AppArmor sends out event messages for things that are in the severity database and above the level selected. Severity levels are numbered 1 through 10, with 10 being the most severe security incident. The
/etc/severity.dbfile defines the severity level of potential security events. The severity levels are determined by the importance of different security events, such as certain resources accessed or services denied.
Click .
Click in the window.
Click + in the YaST Control Center.
After configuring security event notification, read the reports and determine whether events require follow up. Follow up may include the procedures outlined in Section 26.5, “Reacting to Security Event Rejections”.
Novell AppArmor's reporting feature adds flexibility by enhancing the way users can view security event data. The reporting tool performs the following:
Creates on-demand reports
Exports reports
Schedules periodic reports for archiving
E-mails periodic reports
Filters report data by date
Filters report data by other options, such as program name
Using reports, you can read important Novell AppArmor security events reported in
the log files without manually sifting through the messages only useful
to the aa-logprof tool. Narrow down the size of the report by filtering
by date range or program name. You can also export an
html or csv file.
The following are the three types of reports available in Novell AppArmor:
- Executive Security Summary
A combined report, consisting of one or more security incident reports from one or more machines. This report can provide a single view of security events on multiple machines. For more details, refer to Section 26.3.1.3, “Executive Security Summary”.
- Application Audit Report
An auditing tool that reports which application servers are running and whether the applications are confined by AppArmor. Application servers are applications that accept incoming network connections. For more details, refer to Section 26.3.1.1, “Application Audit Report”.
- Security Incident Report
A report that displays application security for a single host. It reports policy violations for locally confined applications during a specific time period. You can edit and customize this report or add new versions. For more details, refer to Section 26.3.1.2, “Security Incident Report”.
To use the Novell AppArmor reporting features, proceed with the following steps:
Open +.
In , click . The window appears. From the window, select an option and proceed to the respective section for instructions:
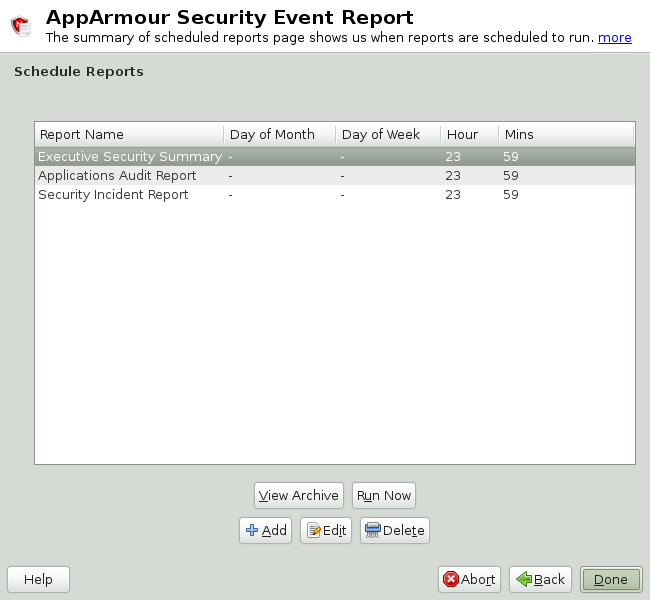
- View Archive
Displays all reports that have been run and stored in
/var/log/apparmor/reports-archived/. Select the report you want to see in detail and click . For instructions, proceed to Section 26.3.1, “Viewing Archived Reports”.- Run Now
Produces an instant version of the selected report type. If you select a security incident report, it can be further filtered in various ways. For instructions, proceed to Section 26.3.2, “Run Now: Running On-Demand Reports”.
- Add
Creates a scheduled security incident report. For instructions, proceed to Section 26.3.3, “Adding New Reports”.
- Edit
Edits a scheduled security incident report.
- Delete
Deletes a scheduled security incident report. All stock or canned reports cannot be deleted.
- Back
Returns you to the Novell AppArmor main screen.
- Abort
Returns you to the Novell AppArmor main screen.
- Next
Performs the same function as the button.
enables you to specify the location of a collection of reports from one or more systems, including the ability to filter by date or names of programs accessed and display them all together in one report.
From the window, select .
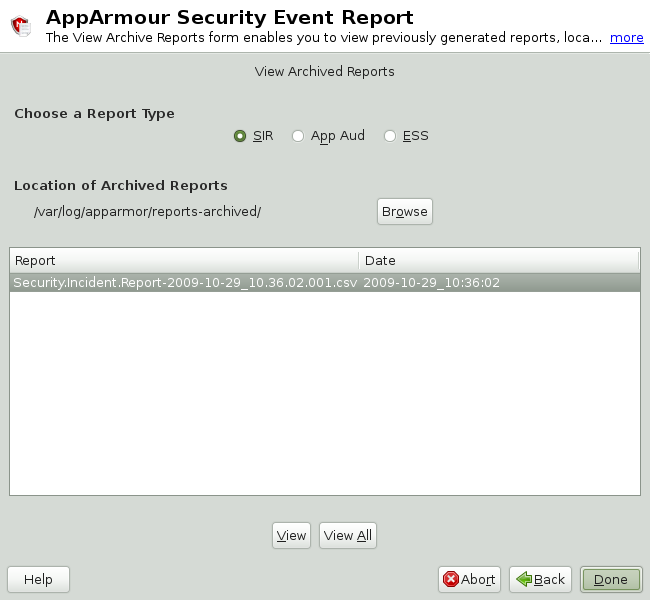
Select the report type to view. Toggle between the different types: (Security Incident Report), (Application Audit), and (Executive Security Summary).
You can alter the directory location of the archived reports in . Select to use the current directory or select to find a new report location. The default directory is
/var/log/apparmor/reports-archived.To view all the reports in the archive, select . To view a specific report, select a report file listed in the field then select .
For and reports, proceed to Step 9.
The opens for reports.
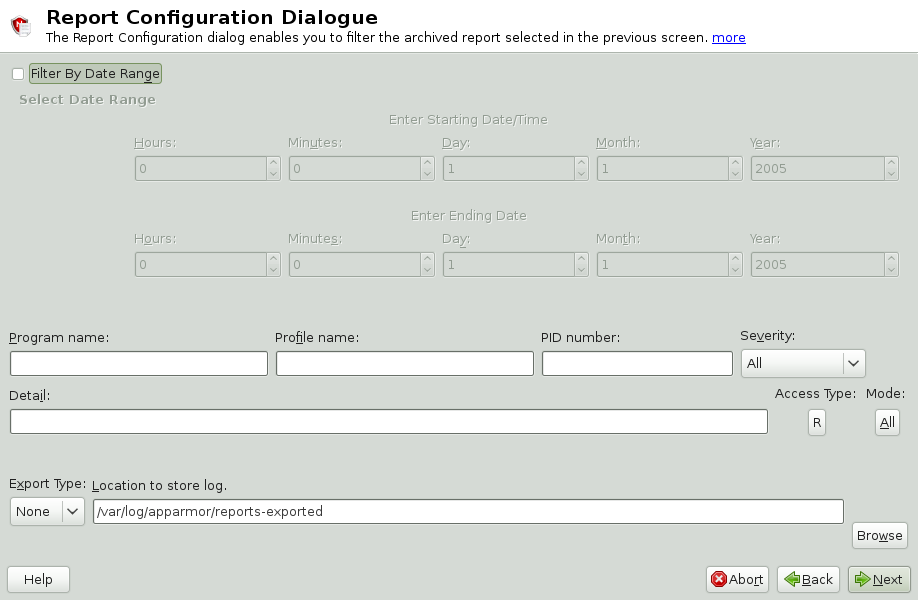
The dialog enables you to filter the reports selected in the previous screen. Enter the desired filter details. The fields are:
- Date Range
To display reports for a certain time period, select . Enter the start and end dates that define the scope of the report.
- Program Name
When you enter a program name or pattern that matches the name of the binary executable of the program of interest, the report displays security events that have occurred for a specific program.
- Profile Name
When you enter the name of the profile, the report displays the security events that are generated for the specified profile. You can use this to see what is being confined by a specific profile.
- PID Number
is a number that uniquely identifies one specific process or running program (this number is valid only during the lifetime of that process).
- Severity
Select the lowest severity level for security events to include in the report. The selected severity level (and above) are then included in the reports.
- Detail
A source to which the profile has denied access. This includes capabilities and files. You can use this field to report the resources to which profiles prevent access.
- Access Type
The access type describes what is actually happening with the security event. The options are
PERMITTING,REJECTING, orAUDITING.- Mode
The is the permission that the profile grants to the program or process to which it is applied. The options are
all(all modes without filtering),r(read),w(write),l(link),x(execute), andm(mmap).- Export Type
Enables you to export a CSV (comma separated values) or HTML file. The CSV file separates pieces of data in the log entries with commas using a standard data format for importing into table-oriented applications. You can enter a path for your exported report by typing the full path in the field provided.
- Location to Store Log
Enables you to change the location at which to store the exported report. The default location is
/var/log/apparmor/reports-exported. When you change this location, select . Select to browse the file system.
To see the report, filtered as desired, select . One of the three reports displays.
Refer to the following sections for detailed information about each type of report.
For the application audit report, refer to Section 26.3.1.1, “Application Audit Report”.
For the security incident report, refer to Section 26.3.1.2, “Security Incident Report”.
For the executive summary report, refer to Section 26.3.1.3, “Executive Security Summary”.
An application audit report is an auditing tool that reports which application servers are running and whether they are confined by AppArmor.
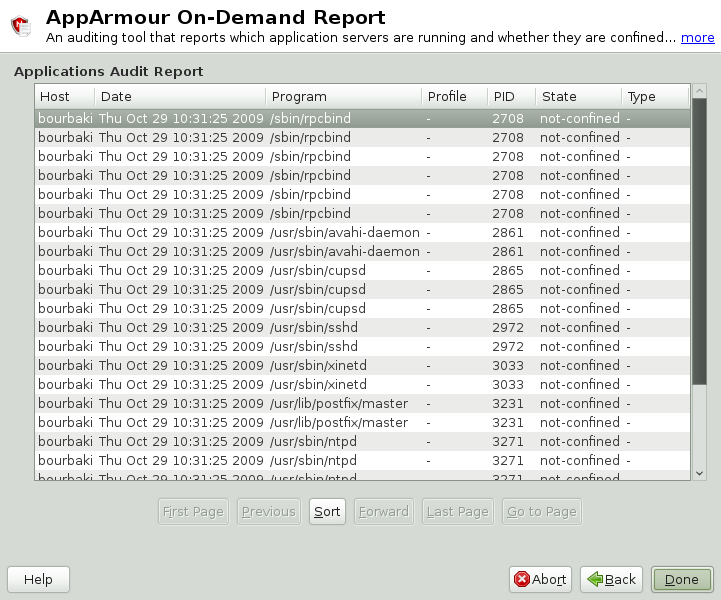 |
The following fields are provided in an application audit report:
- Host
The machine protected by AppArmor for which the security events are reported.
- Date
The date during which security events occurred.
- Program
The name and path of the executing process.
- Profile
The absolute name of the security profile that is applied to the process.
- PID
A number that uniquely identifies one specific process or running program (this number is valid only during the lifetime of that process).
- State
This field reveals whether the program listed in the program field is confined. If it is not confined, consider creating a profile for it.
- Type
This field reveals the type of confinement the security event represents (either complain or enforce). If the application is not confined (state), no type of confinement is reported.
A security incident report displays security events of interest to an administrator. The SIR reports policy violations for locally confined applications during a specified time period. It also reports policy exceptions and policy engine state changes. These two types of security events are defined as follows:
- Policy Exceptions
When an application requests a resource that is not defined within its profile, a security event is triggered. A report is generated that displays security events of interest to an administrator. The SIR reports policy violations for locally confined applications during a specified time period. The SIR reports policy exceptions and policy engine state changes.
- Policy Engine State Changes
Enforces policy for applications and maintains its own state, including when engines start or stop, when a policy is reloaded, and when global security feature are enabled or disabled.
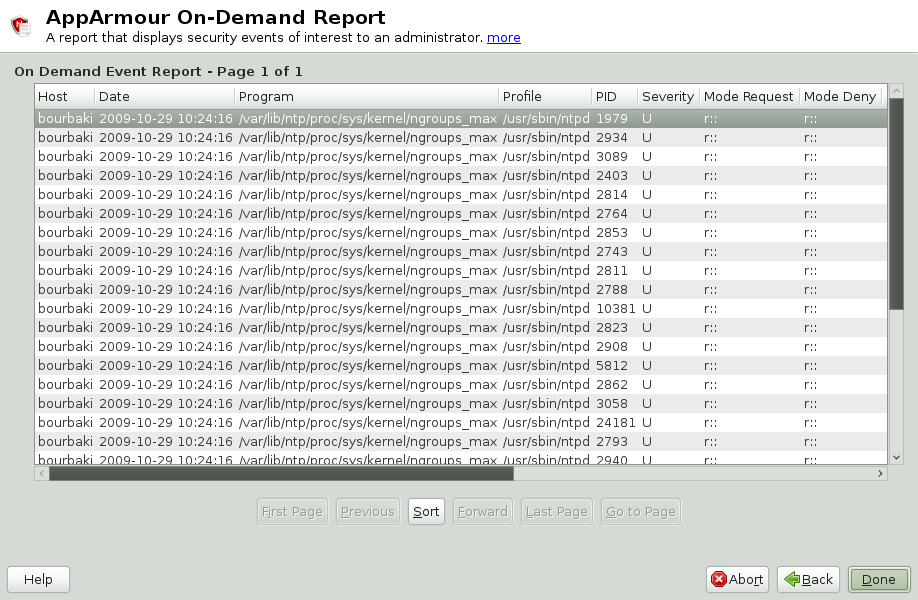 |
The fields in the SIR report have the following meanings:
- Host
The machine protected by AppArmor for which the security events are reported.
- Date
The date during which security events occurred.
- Program
The name of the executing process.
- Profile
The absolute name of the security profile that is applied to the process.
- PID
A number that uniquely identifies one specific process or running program (this number is valid only during the lifetime of that process).
- Severity
Severity levels of events are reported from the severity database. The severity database defines the importance of potential security events and numbers them 1 through 10, 10 being the most severe security incident. The severity levels are determined by the threat or importance of different security events, such as certain resources accessed or services denied.
- Mode
The mode is the permission that the profile grants to the program or process to which it is applied. The options are
r(read),w(write),l(link), andx(execute).- Detail
A source to which the profile has denied access.This includes capabilities and files. You can use this field to report the resources to which the profile prevents access.
- Access Type
The access type describes what is actually happening with the security event. The options are
PERMITTING,REJECTING, orAUDITING.
A combined report consisting of one or more high-level reports from one
or more machines. This report can provide a single view of security
events on multiple machines as long as each machine's data is copied to
the report archive directory, which is
/var/log/apparmor/reports-archived. One line of
the ESS report represents a range of SIR reports.
The following fields are provided in an executive security summary:
- Host
The machine protected by AppArmor for which the security events are reported.
- Start Date
The first date in a range of dates during which security events are reported.
- End Date
The last date in a range of dates during which security events are reported.
- Num Rejects
In the date range given, the total number of security events that are rejected access attempts.
- Num Events
In the date range given, the total number of security events.
- Ave. Sev
This is the average of the severity levels reported in the date range given. Unknown severities are disregarded in this figure.
- High Sev
This is the severity of the highest severity event reported in the date range given.
The report feature enables you to instantly extract report information from the Novell AppArmor event logs without waiting for scheduled events. If you need help navigating to the main report screen, see Section 26.3, “Configuring Reports”. Perform the following steps to run a report from the list of reports:
Select the report to run instantly from the list of reports in the window.
Select or . The next screen is dependent on which report you selected in the previous step. As an example, select a security incident report.
The opens for security incident reports.

The enables you to filter the reports selected in the previous screen. Enter the desired filter details. The following filter options are available:
- Date Range
To limit reports to a certain time period, select . Enter the start and end dates that determine the scope of the report.
- Program Name
When you enter a program name or pattern that matches the name of the binary executable for the relevant program, the report displays security events that have occurred for that program only.
- Profile Name
When you enter the name of the profile, the report displays the security events that are generated for the specified profile. You can use this to see what is confined by a specific profile.
- PID Number
A number that uniquely identifies one specific process or running program (this number is valid only during the lifetime of that process).
- Severity
Select the lowest severity level for security events to include in the report. The selected severity level and above are included in the reports.
- Detail
A source to which the profile has denied access. This includes capabilities and files. You can use this field to report the resources to which profiles prevent access.
- Access Type
The access type describes the action being taken with the security event. The options are
PERMITTING,REJECTING, orAUDITING.- Mode
The mode is the permission that the profile grants to the program or process to which it is applied. The options are
r(read),w(write),l(link), andx(execute).- Export Type
Enables you to export a CSV (comma separated values) or HTML file. The CSV file separates pieces of data in the log entries with commas, using a standard data format for importing into table-oriented applications. Enter a path for your exported report by typing in the full path in the field provided.
- Location to Store Log
Enables you to change the location that the exported report is stored. The default location is
/var/log/apparmor/reports-exported. When you change this location, select . Select to browse the file system.
To see the report, filtered as desired, select . One of the three reports displays.
Refer the following sections for detailed information about each type of report.
For the application audit report, refer to Section 26.3.1.1, “Application Audit Report”.
For the security incident report, refer to Section 26.3.1.2, “Security Incident Report”.
For the executive summary report, refer to Section 26.3.1.3, “Executive Security Summary”.
Adding new reports enables you to create a scheduled security incident report that displays Novell AppArmor security events according to your preset filters. When a report is set up in , it periodically launches a report of Novell AppArmor security events that have occurred on the system.
You can configure a daily, weekly, monthly, or hourly report to run for a specified period. You can set the report to display rejections for certain severity levels or to filter by program name, profile name, severity level, or denied resources. This report can be exported to an HTML (Hypertext Markup Language) or CSV (Comma Separated Values) file format.
![[Note]](admon/note.png) | |
Return to the beginning of this section if you need help navigating to the main report screen (see Section 26.3, “Configuring Reports”). | |
To add a new scheduled security incident report, proceed as follows:
Click to create a new security incident report. The first page of opens.
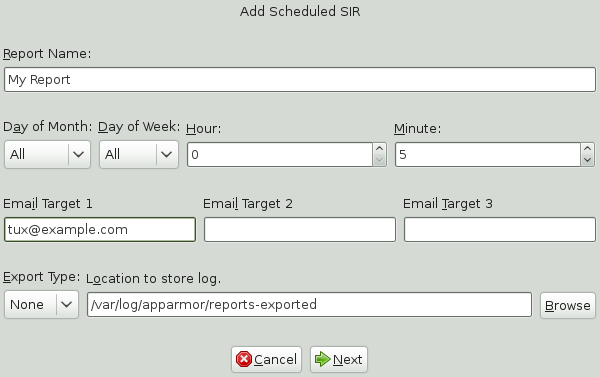
Fill in the fields with the following filtering information, as necessary:
- Report Name
Specify the name of the report. Use names that easily distinguish different reports.
- Day of Month
Select any day of the month to activate monthly filtering in reports. If you select
All, monthly filtering is not performed.- Day of Week
Select the day of the week on which to schedule weekly reports, if desired. If you select
ALL, weekly filtering is not performed. If monthly reporting is selected, this field defaults toALL.- Hour and Minute
Select the time. This specifies the hour and minute that you would like the reports to run. If you do not change the time, selected reports run at midnight. If neither month nor day of week are selected, the report runs daily at the specified time.
- E-Mail Target
You have the ability to send the scheduled security incident report via e-mail to up to three recipients. Just enter the e-mail addresses for those who require the security incident information.
- Export Type
This option enables you to export a CSV (comma separated values) or HTML file. The CSV file separates pieces of data in the log entries with commas using a standard data format for importing into table-oriented applications. Enter a path for your exported report by typing in the full path in the field provided.
- Location to Store Log
Enables you to change the location where the exported report is stored. The default location is
/var/log/apparmor/reports-exported. When you change this location, select . Select to browse the file system.
Click to proceed to the second page of .
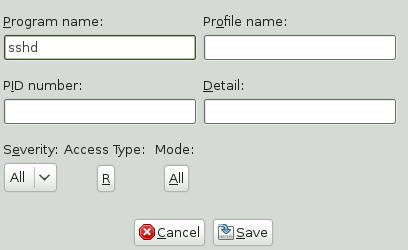
Fill in the fields with the following filtering information, as necessary:
- Program Name
You can specify a program name or pattern that matches the name of the binary executable for the program of interest. The report displays security events that have occurred for the specified program only.
- Profile Name
You can specify the name of the profile for which the report should display security events. You can use this to see what is being confined by a specific profile.
- PID Number
A number that uniquely identifies one specific process or running program (this number is valid only during the lifetime of that process).
- Detail
A source to which the profile has denied access. This includes capabilities and files. You can use this field to create a report of resources to which profiles prevent access.
- Severity
Select the lowest severity level of security events to include in the report. The selected severity level and above are included in the reports.
- Access Type
The access type describes the action being taken with the security event. The options are
PERMITTING,REJECTING, orAUDITING.- Mode
The mode is the permission that the profile grants to the program or process to which it is applied. The options are
r(read),w(write),l(link), andx(execute).
Click to save this report. Novell AppArmor returns to the main window where the newly scheduled report appears in the list of reports.
From the AppArmor screen, you can select and edit a report. The three pre-configured reports (stock reports) cannot be edited or deleted.
![[Note]](admon/note.png) | |
Return to the beginning of this section if you need help navigating to the main report screen (see Section 26.3, “Configuring Reports”). | |
Perform the following steps to modify a report from the list of reports:
From the list of reports in the window, select the report to edit. This example assumes that you have selected a security incident report.
Click to edit the security incident report. The first page of the displays.
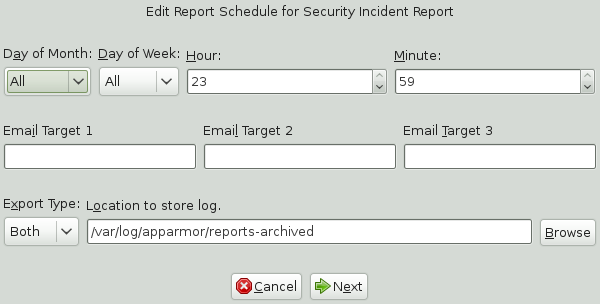
Modify the following filtering information, as necessary:
- Day of Month
Select any day of the month to activate monthly filtering in reports. If you select
All, monthly filtering is not performed.- Day of Week
Select the day of the week on which to schedule the weekly reports. If you select
All, weekly filtering is not performed. If monthly reporting is selected, this defaults toAll.- Hour and Minute
Select the time. This specifies the hour and minute that you would like the reports to run. If you do not change the time, the selected report runs at midnight. If neither the day of the month nor day of the week is selected, the report runs daily at the specified time.
- E-Mail Target
You have the ability to send the scheduled security incident report via e-mail to up to three recipients. Just enter the e-mail addresses for those who require the security incident information.
- Export Type
This option enables you to export a CSV (comma separated values) or HTML file. The CSV file separates pieces of data in the log entries with commas, using a standard data format for importing into table-oriented applications. Enter a path for your exported report by typing the full path in the field provided.
- Location to Store Log
Enables you to change the location where the exported report is stored. The default location is
/var/log/apparmor/reports-exported. When you change this location, select . Select to browse the file system.
Click to proceed to the next page. The second page of opens.
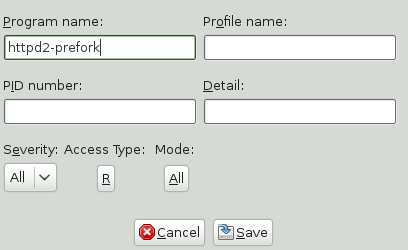
Modify the fields with the following filtering information, as necessary:
- Program Name
You can specify a program name or pattern that matches the name of the binary executable for the program of interest. The report displays security events that have occurred for the specified program only.
- Profile Name
You can specify the name of the profile for which to display security events. You can use this to see what is being confined by a specific profile.
- PID Number
Process ID number is a number that uniquely identifies one specific process or running program (this number is valid only during the lifetime of that process).
- Detail
A source to which the profile has denied access. This includes capabilities and files. You can use this field to create a report of resources to which profiles prevent access.
- Severity
Select the lowest severity level for security events to include in the report. The selected severity level and above are included in the reports.
- Access Type
The access type describes the action being taken with the security event. The options are
PERMITTING,REJECTING, orAUDITING.- Mode
The mode is the permission that the profile grants to the program or process to which it is applied. The options are
r(read),w(write),l(link), andx(execute).
Select to save the changes to this report. Novell AppArmor returns to the main window where the scheduled report appears in the list of reports.
enables you to permanently remove a report from the list of Novell AppArmor scheduled reports. To delete a report, follow these instructions:
To remove a report from the list of reports, highlight the report and click .
From the confirmation pop-up, select if you do not want to delete the selected report. If you are sure you want to remove the report permanently from the list of reports, select .
The Linux audit framework contains a dispatcher that can send AppArmor events
to any consumer application via dbus. The GNOME AppArmor Desktop Monitor
applet is one example of an application that gathers AppArmor events via
dbus. To configure audit to use the dbus dispatcher, just set the
dispatcher in your audit configuration in
/etc/audit/auditd.conf to
apparmor-dbus and restart auditd:
dispatcher=/usr/bin/apparmor-dbus
Once the dbus dispatcher is configured correctly, add the AppArmor Desktop
Monitor to the GNOME panel by right-clicking the panel and selecting
+. As soon as a REJECT
event is logged, the applet's panel icon changes appearance and you can
click the applet to see the number of reject events per confined
application. To view the exact log messages, refer to the audit log under
/var/log/audit/audit.log. React to any
REJECT events as described in
Section 26.5, “Reacting to Security Event Rejections”.
When you receive a security event rejection, examine the access violation and determine if that event indicated a threat or was part of normal application behavior. Application-specific knowledge is required to make the determination. If the rejected action is part of normal application behavior, run aa-logprof at the command line or the in Novell AppArmor to update your profile.
If the rejected action is not part of normal application behavior, this access should be considered a possible intrusion attempt (that was prevented) and this notification should be passed to the person responsible for security within your organization.
In a production environment, you should plan on maintaining profiles for all of the deployed applications. The security policies are an integral part of your deployment. You should plan on taking steps to back up and restore security policy files, plan for software changes, and allow any needed modification of security policies that your environment dictates.
Backing up profiles might save you from having to reprofile all your programs after a disk crash. Also, if profiles are changed, you can easily restore previous settings by using the backed up files.
Back up profiles by copying the profile files to a specified directory.
You should first archive the files into one file.To do this, open a terminal window and enter the following as
root:tar zclpf profiles.tgz /etc/apparmor.d
The simplest method to ensure that your security policy files are regularly backed up is to include the directory
/etc/apparmor.din the list of directories that your backup system archives.You can also use scp or a file manager like Konqueror or Nautilus to store the files on some kind of storage media, the network, or another computer.
Maintenance of security profiles includes changing them if you decide that your system requires more or less security for its applications. To change your profiles in Novell AppArmor, refer to Section 22.3, “Editing Profiles”.
When you add a new application version or patch to your system, you should always update the profile to fit your needs. You have several options, depending on your company's software deployment strategy. You can deploy your patches and upgrades into a test or production environment. The following explains how to do this with each method.
If you intend to deploy a patch or upgrade in a test environment, the best method for updating your profiles is one of the following:
Run the profiling wizard by selecting in YaST. This creates a new profile for the added or patched application. For step-by-step instructions, refer to Section 22.1, “Adding a Profile Using the Wizard”.
Run aa-genprof by typing aa-genprof in a terminal while logged in as
root. For detailed instructions, refer to Section 23.6.3.4, “aa-genprof—Generating Profiles”.
If you intend to deploy a patch or upgrade directly into a production environment, the best method for updating your profiles is one of the following:
Monitor the system frequently to determine if any new rejections should be added to the profile and update as needed using aa-logprof. For detailed instructions, refer to Section 23.6.3.5, “aa-logprof—Scanning the System Log”.
Run the YaST to learn the new behavior (high security risk as all accesses are allowed and logged, not rejected). For step-by-step instructions, refer to Section 22.5, “Updating Profiles from Log Entries”.